In today’s tutorial, we’re going to be looking at one of Google Analytics’ most recent additions to its feature set; Experiments. Using this tool, I’ll be showing you how to serve up different variations of a page to determine which one is the most successful in converting visitors to the site.
Preamble
If you’ve ever created a website, you’ll almost certainly be familiar with Google Analytics. With a free Google account and a snippet of code, you are able to track visitors to your sites and drill down on the data with startling focus.

From small personal projects to enterprise level sites, Google Analytics has established itself as the market leader for very good reasons; it’s free, simple to implement and is suitable for the casual user or even the most battle-hardened marketer.
Ready to get started? Let’s begin!
A Brief Introduction to Split Testing
We’ve covered split testing before as part of Ian’s thorough roundup on conversion and online marketing, but let’s take a brief look at split testing in the online arena.
By serving up different versions of a page to simultaneous visitors, we’re effectively doing what people in marketing circles refer to as Split Testing. The ultimate goal of this approach is to determine which of a group of webpages (or brochures, banner ads, text ads, etc.) converts visitors most effectively. While a ‘conversion’ could be just about anything, typically website owners are interested in purchases, signups, account registrations or even getting visitors to follow them on social channels.
Variations must be run all at the same time.
The most important concept to grasp about split testing is that the variations must be run all at the same time. In other words, it would not be considered an effective split test to load up one page for a month, collect the data and then upload a different page to collect and compare the data again. A key part of split testing is to ensure that as many factors as possible that could influence a site visitor are removed.
Up until fairly recently, A/B Split testing (i.e. testing between two variations) was the standard approach for testing online conversions. The idea with A/B split testing is to arrive at a winner and then rinse and repeat several more times, each time getting closer to the page that converts the maximum amount of visitors. While fairly effective, A/B Split Testing has some critical limitations which we’ll discuss in a moment.
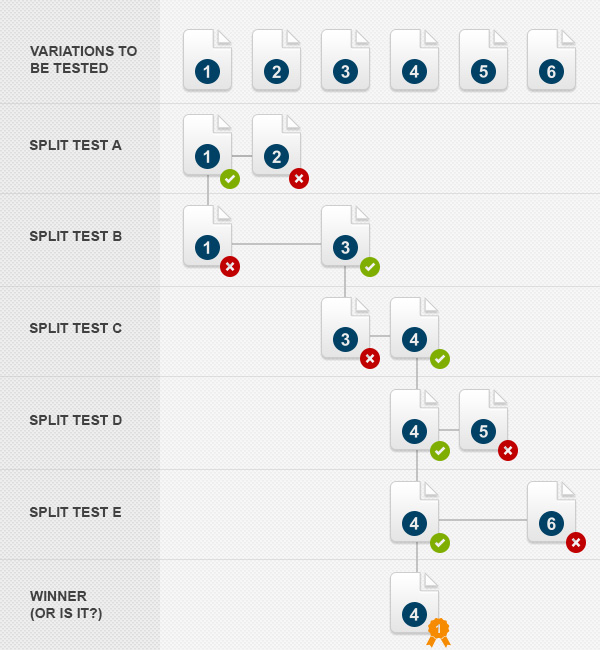
The question is, is this a robust way to really arrive at the best converting page? There are a number of problems with the process depicted in the image above:
- Firstly, if we assume that each test takes a week to conduct, the process to arrive at a winning page will take a painfully long five weeks to conduct. Not only is this a long time when your site is relying on successful conversions, a lot can happen in five weeks on the Internet. Even a change in the way that Google indexes your page could deliver a drastically different set of users (just like we saw in the latest Google ‘Penguin’ update). This means that in essence we could be comparing apples to oranges between the first split test and the final test almost a month and a half later.
- Secondly, although we know that Page One outperformed Page Two in the first test, we can’t be sure that Page Two wouldn’t outperform Page Three, since we have not compared them side by side.
A better alternative to this method is to compare all of the page variations against each other and at the same time, as shown here:

In this example, we can be sure (beyond reasonable doubt) that Page Four is indeed the best performing page since all of the pages are tested against each other within the same time period, with (we can assume) a consistent visitor base.
What we’ll be doing today is to use Google Analytics’ Experiments to run three page variations side-by-side, instead of multiple iterations of the standard two variations in traditional A/B split testing. While I’m using three variations, you are currently able to run six page variations in a single ‘experiment’.
The Scenario
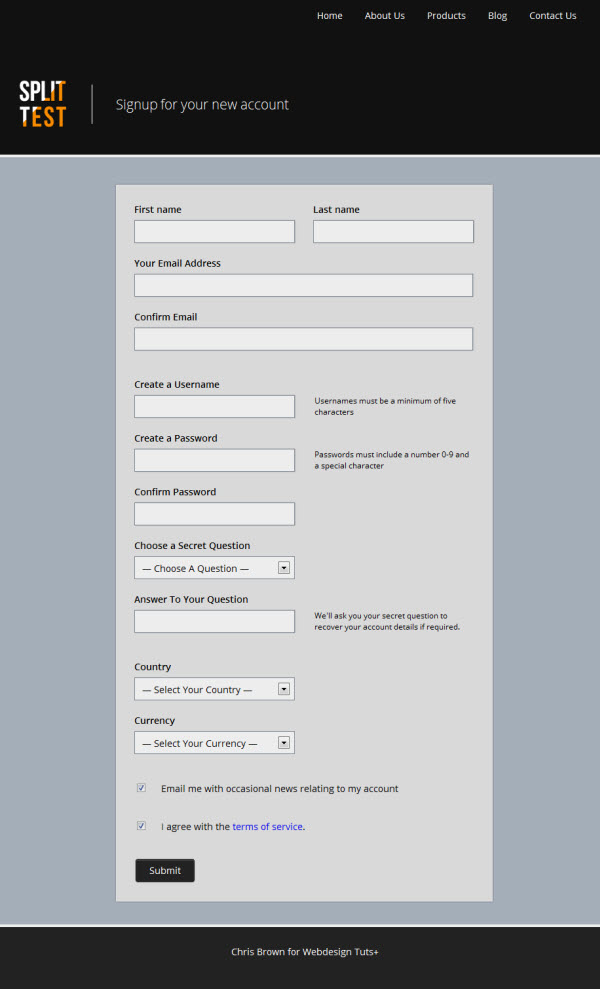
In today’s project, we’ve been put in charge of increasing the amount of successful account registrations for a fictional company. They’ve noticed that a significant amount of visitors to the site arrive at the account signup page but drop off before actually submitting the form.
Here’s a screenshot (resized for the tutorial) of the current signup page or you can view the page online.
Note: this tutorial isn’t going to be looking at the design of the page and its variations. If you’re interested in looking into the code, you can download all of the files from the resources section of this tutorial.
Also, for the sake of simplicity and brevity, these pages are pretty bare bones and and do not include any server-side scripts to collect the form data and are not examples of working production forms.
At this stage, we can only speculate to as what the reason for the drop off might actually be, but a good place to start is by addressing the length of the form. Currently the signup page requires the user to complete a whopping fourteen separate actions in order to create an account.
Assuming that the user is able to return and add their personal details (e.g. their country and preferred currency) after their account has been created, a logical page variation to serve visitors to the site is a trimmed down form that requires fewer actions to complete.
With that attack plan in mind, here’s the second page variation that we’ll be using in our experiment:

For our final page variation, let’s trim down the form once more so as to only include the absolute bare necessities in order to create an account, namely the username, password fields, email address and acknowledgement of the terms of service.
Here’s an image of the third page variation:

Finally, we have a confirmation page that will be displayed to the visitor once the form has been successfully completed.

Now that we’ve got our three page variations, let’s set up the required elements in Google Analytics and test them side by side.
Step 1: Create a Google Analytics Account
I’m sure that many of you will be familiar with Google Analytics already, but for the sake of completeness, we’re going to step through each and every step required to enable analytics on the site, define a goal and enable the experiment itself.
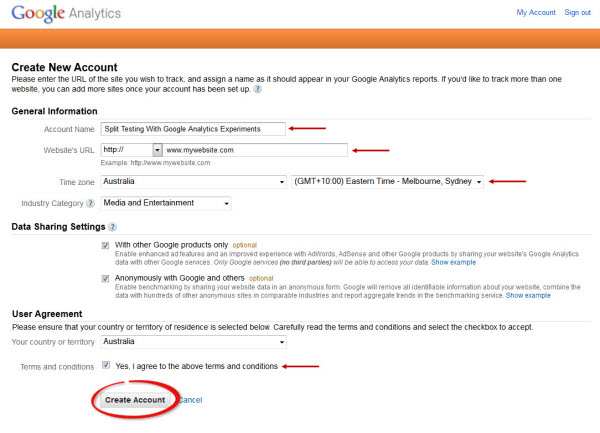
Head on over to Google Analytics and sign in with your Google Account (or set up a new account). Assuming that you haven’t already added an analytics account to your profile, you’ll be presented with the following screen. Click the ‘Sign Up’ button to get started.

On the following page, complete the form fields as they relate to your project:
Step 2: Add the Google Analytics Snippet
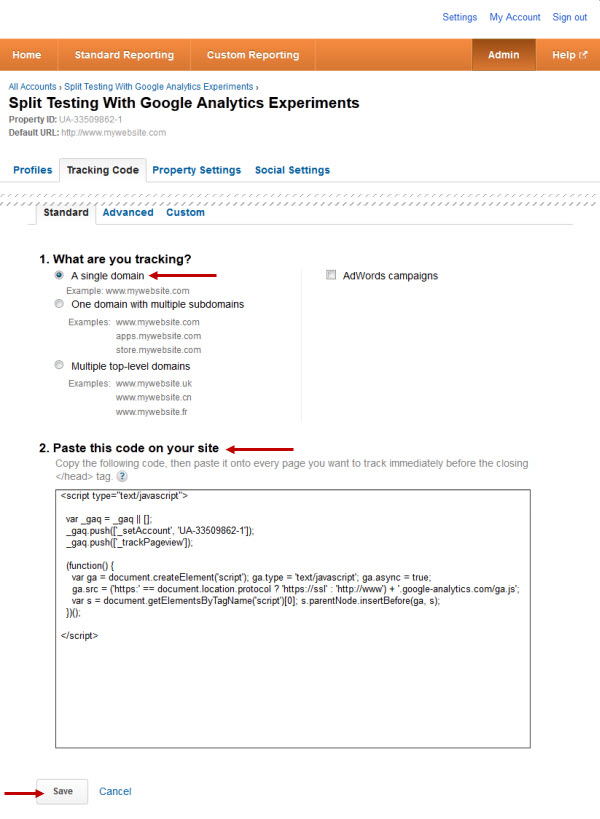
The tracking ability of Google Analytics is powered by a JavaScript snippet, and on the following page, you’ll receive the required code and instructions on how to add it to your site. Simply copy the code to your clipboard, and paste it to each page that you want to track with Google Analytics.
On the site, the help text suggests that you add this snippet immediately before the closing </head> tag, which will make sure a pageview is registered even if the entire page isn’t loaded before the user moves on. However, it’s ordinarily considered best practise to add your scripts to the bottom of an html page, before the closing </body> tag.
While both approaches will work fine, in this situation we want to make sure that our signup pages load completely before the Analytics script is fired.
For this project, I’ve added this script to the three signup pages (signup1.html, signup2.html & signup3.html) and the confirmation.html page, like so:
<!doctype html>

<head>
<!-- head content -->
</head>

<html>
<body>

<!-- page markup / content -->

  <script type="text/javascript">
    var _gaq = _gaq || [];
    _gaq.push(['_setAccount', 'UA-33487303-1']); // This UA code identifies the page as part of the Analytics account.
    _gaq.push(['_trackPageview']);
    _gaq.push(['_setDomainName', 'none']);

    (function() {
    var ga = document.createElement('script'); ga.type = 'text/javascript'; ga.async = true;
    ga.src = ('https:' == document.location.protocol ? 'https://ssl' : 'http://www') + '.google-analytics.com/ga.js';
    var s = document.getElementsByTagName('script')[0]; s.parentNode.insertBefore(ga, s);
    })();
  </script>

</body>
</html>
Once you’ve added the code, upload the pages to a web server via FTP. It’s also important to note that Google Analytics often takes 24 – 48 hours to start collecting data, so be patient over the first couple of days before see your visitor data.
Step 3: Create a Goal
Before we set up and enable the experiment itself, we need to create a goal for measuring.
Google Analytics can be configured to create and monitor very sophisticated goals, including multi-channel goal funnels and ecommerce tracking. In today’s example, we’re keeping it simple by defining a successful conversion (i.e. our Goal) as the /confirmation.html URL destination. In other words, we want to track every instance of a user completing any one of the three form variations, clicking the ‘Submit’ button and arriving at the ‘Thanks For registering with us’ page.
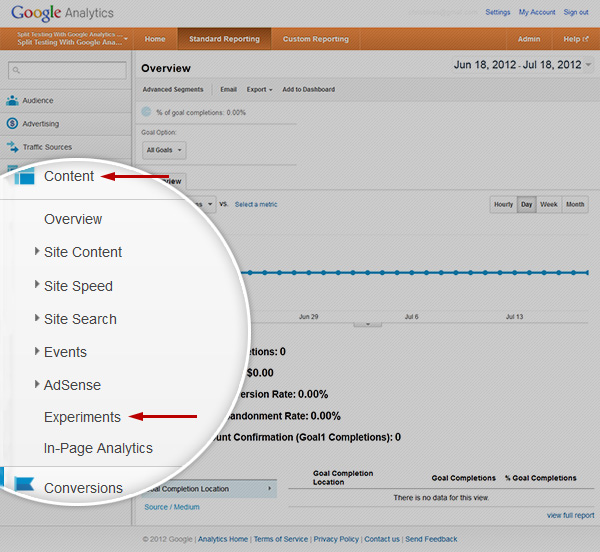
From the main left hand menu in the Google Analytics interface, select the ‘Overview’ item from the ‘Conversions’ heading:

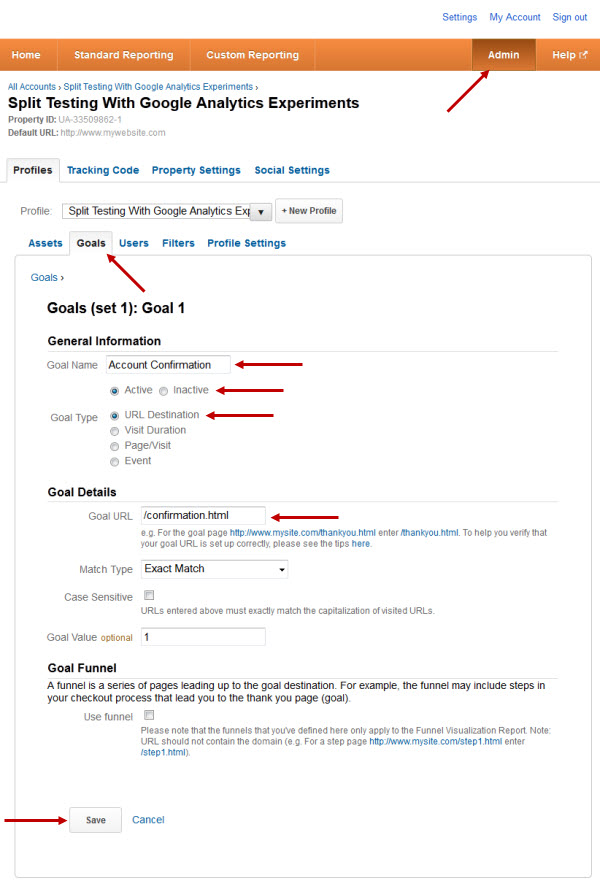
If this is the first goal that you’ve set up, you should be taken automatically to the ‘Create a New Goal’ page. If not, click the ‘Admin’ menu item in the top right of your screen and make sure that you’re looking at the ‘Goals’ tab.
Give your new goal a name, select the goal type as a URL destination and enter the path, in this case, /confirmation.html.
If your goal has an actual dollar value associated to it (for example a paid membership to a site), you can add this amount to the ‘Goal Value’ text field. We’re not going to be using a goal funnel today, so we can just save our new goal.
Step 4: Access the Experiments Feature
With our goal set up, we can now start an experiment to determine which of our pages will perform the best in terms of successful account registration.
Under the ‘Content’ section of the main left menu, select ‘Experiments’.
Note: as with many Google products, the Experiments feature is being delivered as part of a staged rollout. If you do not currently have access to Experiments, you’ll need to exercise patience and wait for your Google account to be updated with this feature.
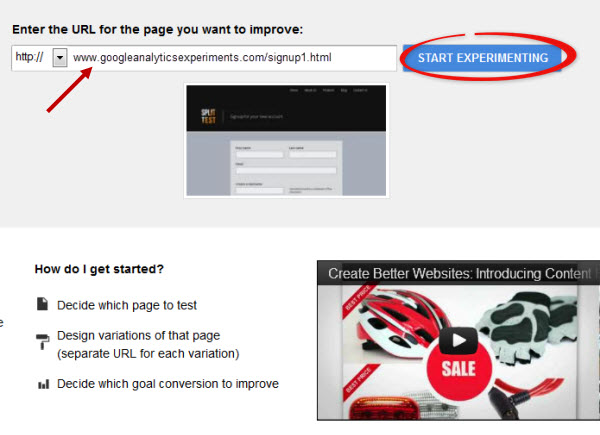
To get started, add in the URL of the page that we want to test, in this case, signup1.html. This isn’t a live URL – it’s just being used for the purposes of the tutorial.
Step 5: Create an Experiment
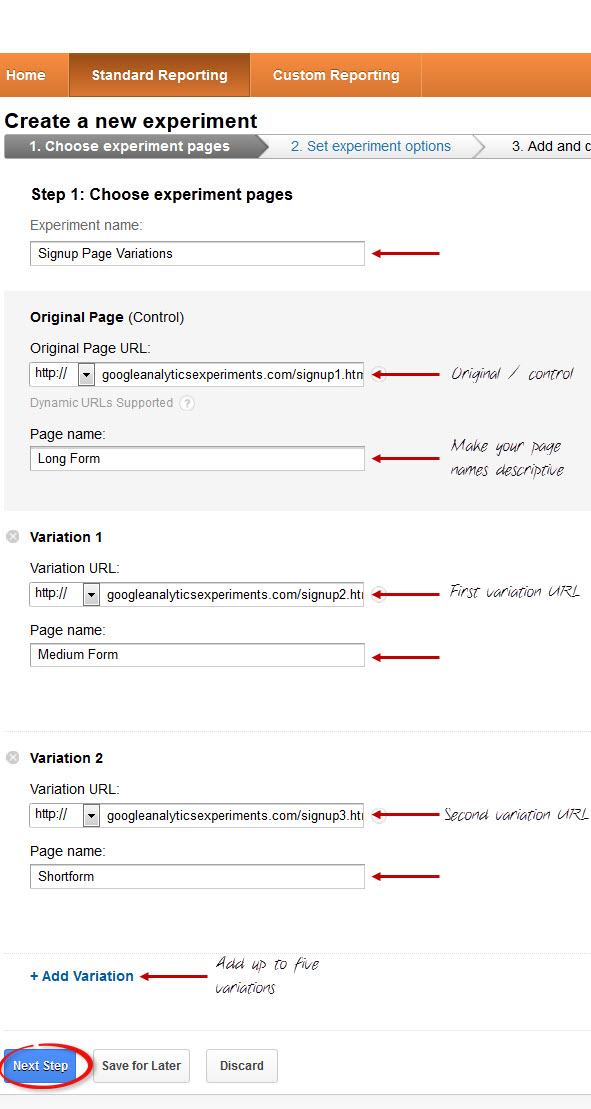
After accessing the experiments feature, you are presented with a four step experiments creation wizard.
Start by confirming the control page (i.e. /signup1.html), and then add the URLs for each of the page variations. Make sure that you give each variation a descriptive name and not just a generic ‘variation one / variation two / variation three’ title — it will make analysis of the experiment far easier in the later stages.
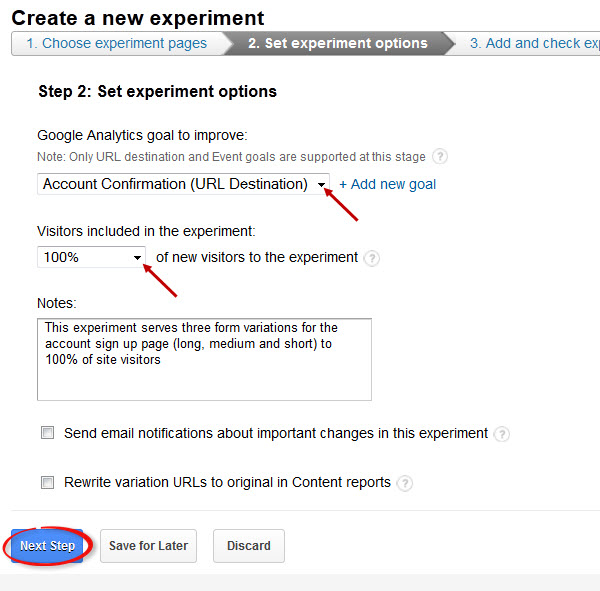
On the next page of the experiments registration wizard, we will be referencing the goal that we created in Step Three as the measurable metric.
In this experiment, we want to serve page variations to 100% of visitors. If you were making sweeping changes to an established site, you may choose to limit the amount of visitors that take part in the experiment to minimize any potential impact.
On the third page, you’ll be given another code block that will be added to the control page (in this case /signup1.html). Add this code to the top of the control page, just after the opening <head> tag. Note, for this script — unlike the tracking code — we definitely want this code at the very top of the page since this is how the page variations are going to be served to visitors.
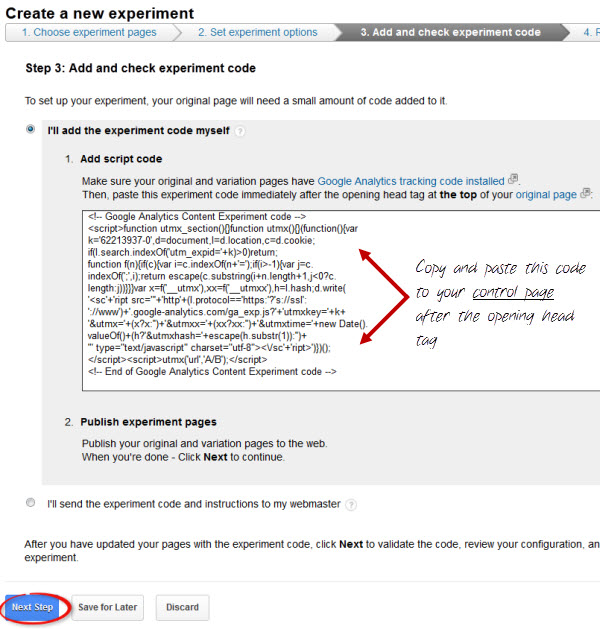
The final code for the control page (i.e. /signup1.html) will look like this:
<!doctype html>

<head>
  <!-- Google Analytics Content Experiment code -->
<script>function utmx_section(){}function utmx(){}(function(){var
k='62181940-0',d=document,l=d.location,c=d.cookie;
if(l.search.indexOf('utm_expid='+k)>0)return;
function f(n){if(c){var i=c.indexOf(n+'=');if(i>-1){var j=c.
indexOf(';',i);return escape(c.substring(i+n.length+1,j<0?c.
length:j))}}}var x=f('__utmx'),xx=f('__utmxx'),h=l.hash;d.write(
'<sc'+'ript src="'+'http'+(l.protocol=='https:'?'s://ssl':
'://www')+'.google-analytics.com/ga_exp.js?'+'utmxkey='+k+
'&utmx='+(x?x:'')+'&utmxx='+(xx?xx:'')+'&utmxtime='+new Date().
valueOf()+(h?'&utmxhash='+escape(h.substr(1)):'')+
'" type="text/javascript" charset="utf-8"></sc'+'ript>')})();
</script><script>utmx('url','A/B');</script>
<!-- End of Google Analytics Content Experiment code -->

  <meta charset="utf-8">
  <meta http-equiv="X-UA-Compatible" content="IE=edge,chrome=1">
  <title>Signup Form 1</title>

  <!-- Stylesheet -->
  <link rel="stylesheet" href="style.css">

  <!-- google webfonts -->
  <link href='http://fonts.googleapis.com/css?family=Open+Sans:400,300,600' rel='stylesheet' type='text/css'>
  </head>
Upload your new control page with the experiments script to your server.
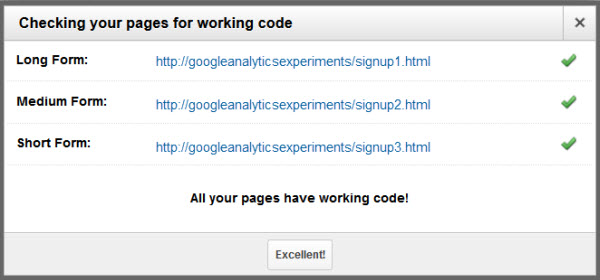
In the fourth stage, you can check that everything is working as it should be and that Google Analytics is registering all of the pages and is ready to start conducting the experiment.
Step 6: Testing Your Experiment
Great work! You’ve created your first Google Analytics Experiment and you’re one step closer to improving your conversion rate.
As it takes 24-48 hours for the Experiments panel to start displaying data, let’s just make sure that our experiment is indeed serving up different page variations.
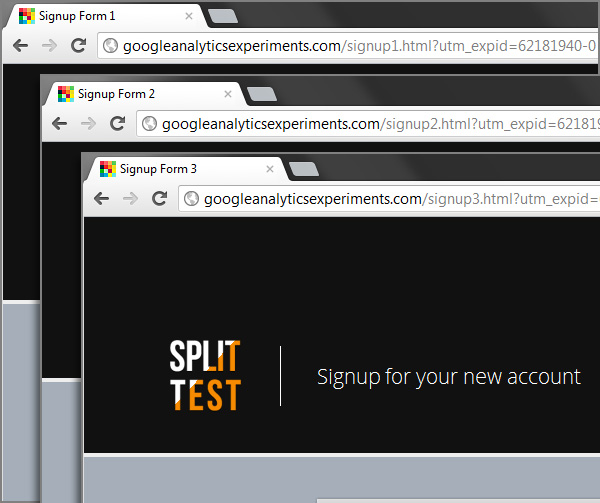
Open your browser and navigate to the control page (i.e. /signup1.html). If the experiment is working correctly, you will be redirected automatically to one of the three page variations. Your address bar will show the variation with an appended ID, indicating that the experiment has served one of the variations to your browser.
Behind the scenes, Google Analytics has added a cookie to your browser session that ‘remembers’ which page variation you were served. You’ll note that if you refresh the page, or return to the page later, you’ll always be shown the original page variation — an essential part of ensuring that you provide your visitors with a consistent user experience.
You can clear your browser’s cookies, site and plugin data to be served a different variation of the page.
Step 7: Analyzing the Experiment Data
Once created, the experiment simply runs itself, collecting data until a clear winner can be determined by Google Analytics. The length of time that your experiment will need to run depends on a number of factors, including overall visitors and how closely the variations perform to one another.
Let’s take a look at this experiment while it’s in progress and pick out a few points worth discussing.
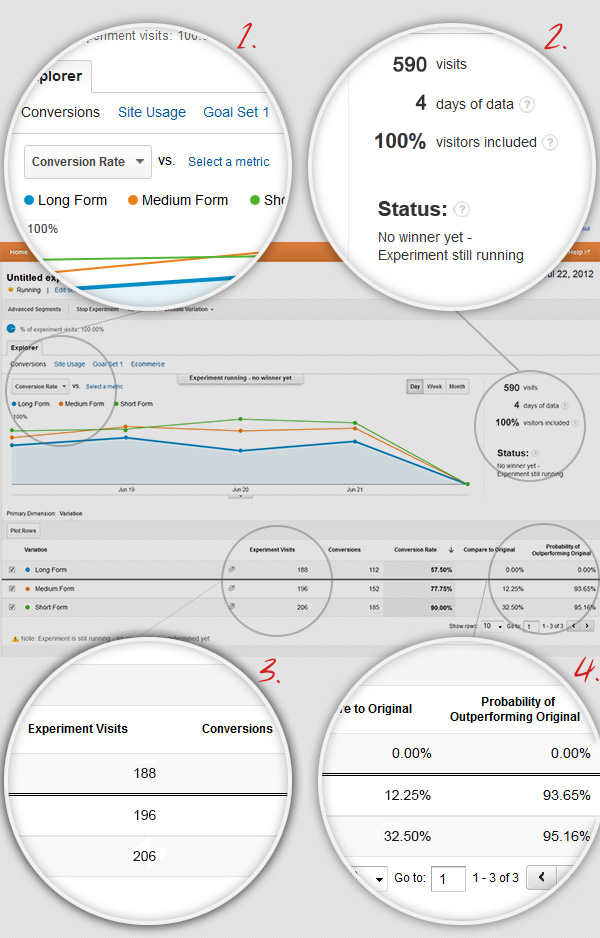
- The default graph data plots the conversion rate of each of the page variations against the time that the experiment has been running, which is probably the most important metric to be considering for our purposes today. The dropdown selection also allows you to plot the data relating to a number of other metrics including site usage, successful goal count, and a selection of standard Analytics metrics such as pages per visit, bounce rate, percentage of new visits and so on.
- To the right of page, the in-progress experiment is summed up, tallying the overall visits to the experiment pages, the amount of time lapsed and the experiment status — in this case, Analytics has not established a clear winner.
- An interesting point to note is that Analytics does not necessarily distribute the pages one-for-one. While at the start of the experiment you could expect an comparative amount of visits for each page variation. As the experiment progresses and one or more of the pages starts to outperform the others, Analytics will start favoring the better performing pages. In this case, our third variation (the short form) has been distributed to around 36% of site visitors, compared to the long form (variation one) being displayed to around 31% of visitors.
- In the data table towards the bottom of the page, Analytics compares the conversion rate of each variation against the control and calculates the probability of the variation outperforming the original. So, in this example, while we don’t have a clear winner, we could already be confident that both variations would be better alternatives to the long form with a better than 93% chance of them converting visitors more successfully.
Step 8: Arriving at a Winner
As mentioned, the time taken to arrive at a winner will depend on the performance of the page variations in relation to the control page. Whether it takes three days or three weeks to arrive at a conclusion, you can be confident beyond reasonable doubt that the winner of the experiment will indeed be the best performer in terms of the goal that is being measured.
After eight days of data and 1240 visits, Analytics has arrived at the clear winner being (you guessed it), our short form page.
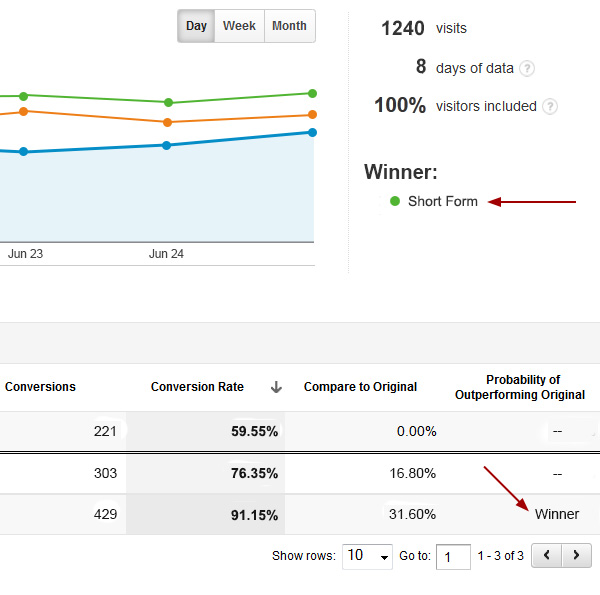
Step 9: We Have a Winner, What Now?
Now that our experiment has concluded, we need to take action. Since the short form performed so well with a conversion rate of around 91.5%, the most obvious thing to do is to replace the control page (i.e. the long form) with the winning variation.
From here, we will need to perform some additional analysis and make an important decision. While we’ve established our goal as visits to the confirmation page, it’s not our real goal. The actual measure of success is of course people using the service (whatever that service actually is). Assuming that all of the additional information is required (the country, the preferred currency, etc.) is necessary, additional analysis would be required to make sure that successful registrants do indeed fill in this information once their account is established (an exercise for another experiment).
Finally, the next decision to make is to whether or not to invest the time to create additional variations for our form to try and further improve upon the 91.5% conversion rate. For example, a different design or copy variations may boost the conversion rate. Really, experiments could be continued to be performed until a 100% conversion rate is achieved. With that said, what we need to consider is the rate of diminishing returns. There will be a point where the time and effort required to improve the conversion rate does not give an adequate return on investment, and our time would be better served testing and optimizing other pages of our site.
Conclusion
In this tutorial, we’ve only just scratched the surface of Experiments from Google Analytics, and we could continue discussing the intricacies of the available data ad infinitum. With that said, in only a few simple steps we’ve establised a program that is far more efficient than traditional A/B split testing and we’ve arrived at an incontrivertable result that far outperforms the control page.
While we’ve created an experiment that serves completely different pages in terms of content, the same approach can be taken to test far more subtle page elements. For example, a differently colored button, a slightly different layout or minor copy changes can result in markedly improved conversion rates – all of which can be tested using this split testing method.
Importantly, this approach to testing our designs takes the guess work out of effective design. As designers working with client stakeholders (and often making decisions by the dreaded committee), it’s easy to lose sight of the forest for the trees and make design decisions based on assumption rather than hard data. Establishing a split testing program like this is the surest way of improving your conversions, no matter what your goal may be.
How will you use Google Experiments? Leave a comment below — we’d love to hear your thoughts!